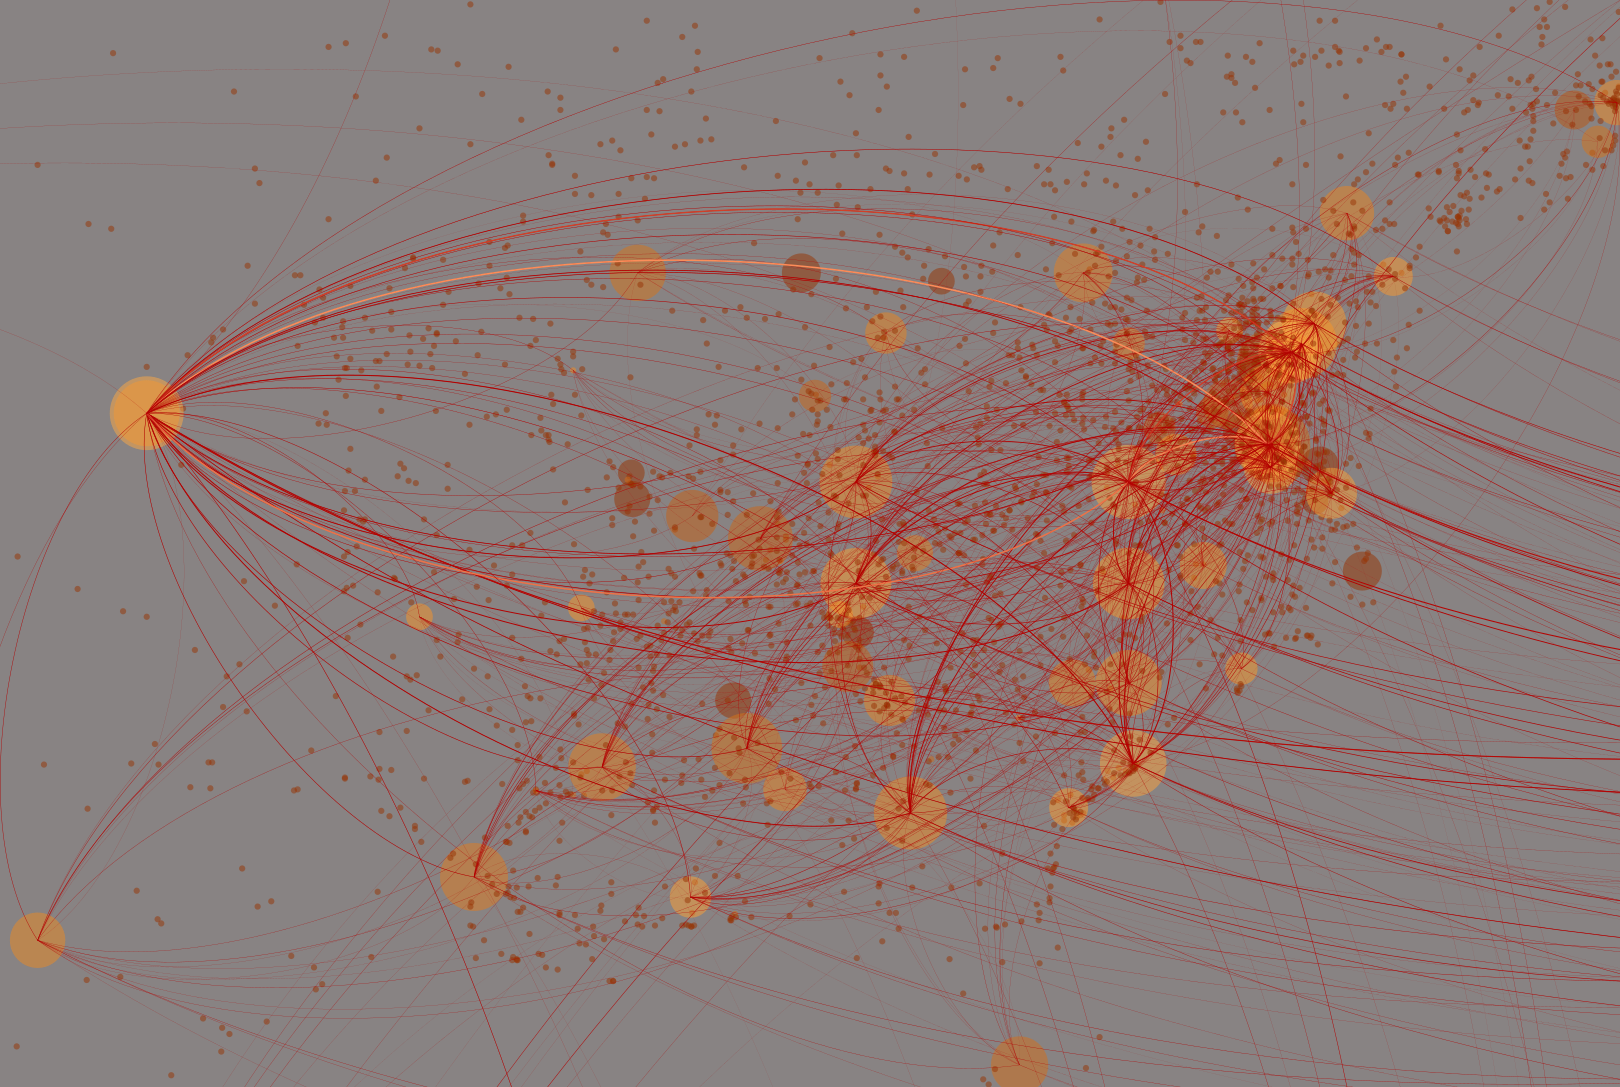
A place-network for the dispatch
Below are the libraries I’m going to use:
import pandas as pd #for data-structures
import numpy as np #for arrays
from bs4 import BeautifulSoup #to parse xml
import requests #To request files from the web
import re #RegExes!
from tqdm import tqdm_notebook as tqdm # Nice utility to see how fast a loop is progressing.
import traceback #Have a look at errors in exceptions, without interrupting the loop
import json # Parse json.

from sklearn.feature_extraction.text import CountVectorizer #Easy way of gettin co-occurence-data
import networkx as nx #Networks in python, writes to gephi.
Because I saved of the relevant datasets from homework no. 10, we can simply load them, which gives us two datasets, one of which contains in each row a publication-date of the dispatch and a tgn-id, and one which links those ids to latitudes and longitudes:
tgn = pd.read_csv('tgn_data.csv')
tgn['ids'] = tgn['identifier'].astype(str).str.replace('\.0','') #correcting some errors in the data: ids were saved as floats, not strings.
df = pd.read_csv('place_ids_by_date.csv')
We can use a simple trick to get a network from this data: First we group by the date-column, which joins all ideas mentioned at a specific date into one long string. Then we vectorize these strings. Calculating the dot-product of the transposed vectors with themselves results in a co-occurence matrix:
places_by_edition = df.groupby('date')['tgn_id'].agg({'tgn_id': lambda x: ''.join(str(x))})
vec = CountVectorizer(binary=True,min_df=2)
bow = vec.fit_transform([str(x) for x in places_by_edition['tgn_id']])
adj = np.array(bow.T.dot(bow).todense())
np.fill_diagonal(adj, 0)
This co-occurence matrix can now be transformed into a graph using networkx:
G = nx.from_numpy_array(adj.astype(float), parallel_edges=False)
mapping = dict(zip(list(G.nodes()), vec.get_feature_names()))
G = nx.relabel_nodes(G, mapping)
Now we add the latitudes and longitudes from the dataframe used before as attributes to the nodes:
longs = dict(zip(tgn['ids'], tgn['longitude']))
lats = dict(zip(tgn['ids'], tgn['latitude']))
nx.set_node_attributes(G, longs, 'longitude')
nx.set_node_attributes(G, lats, 'latitude')
Then it’s just a matter of filtering out missing values and saving. networkx has also export-options for Gephi-files, but they weren’t really beneficial here:
filtered_G = G.subgraph([x[0] for x in G.nodes(data=True) if x[1] != {}])
pd.DataFrame([[x[0],x[1],x[2]['weight']] for x in list(nx.to_edgelist(filtered_G))],columns=['source','target','weight']).to_csv('place_edges.csv', index=False)
pd.DataFrame([[x[0],x[1]['longitude'],x[1]['latitude']] for x in filtered_G.nodes(data=True)],columns=['id','lon','lat']).to_csv('place_nodes.csv', index=False)
Now it’s simpy a matter of pulling things into Gephi, playing a little with the settings, and exporting. Here is the sub-map of the US as a sample:
