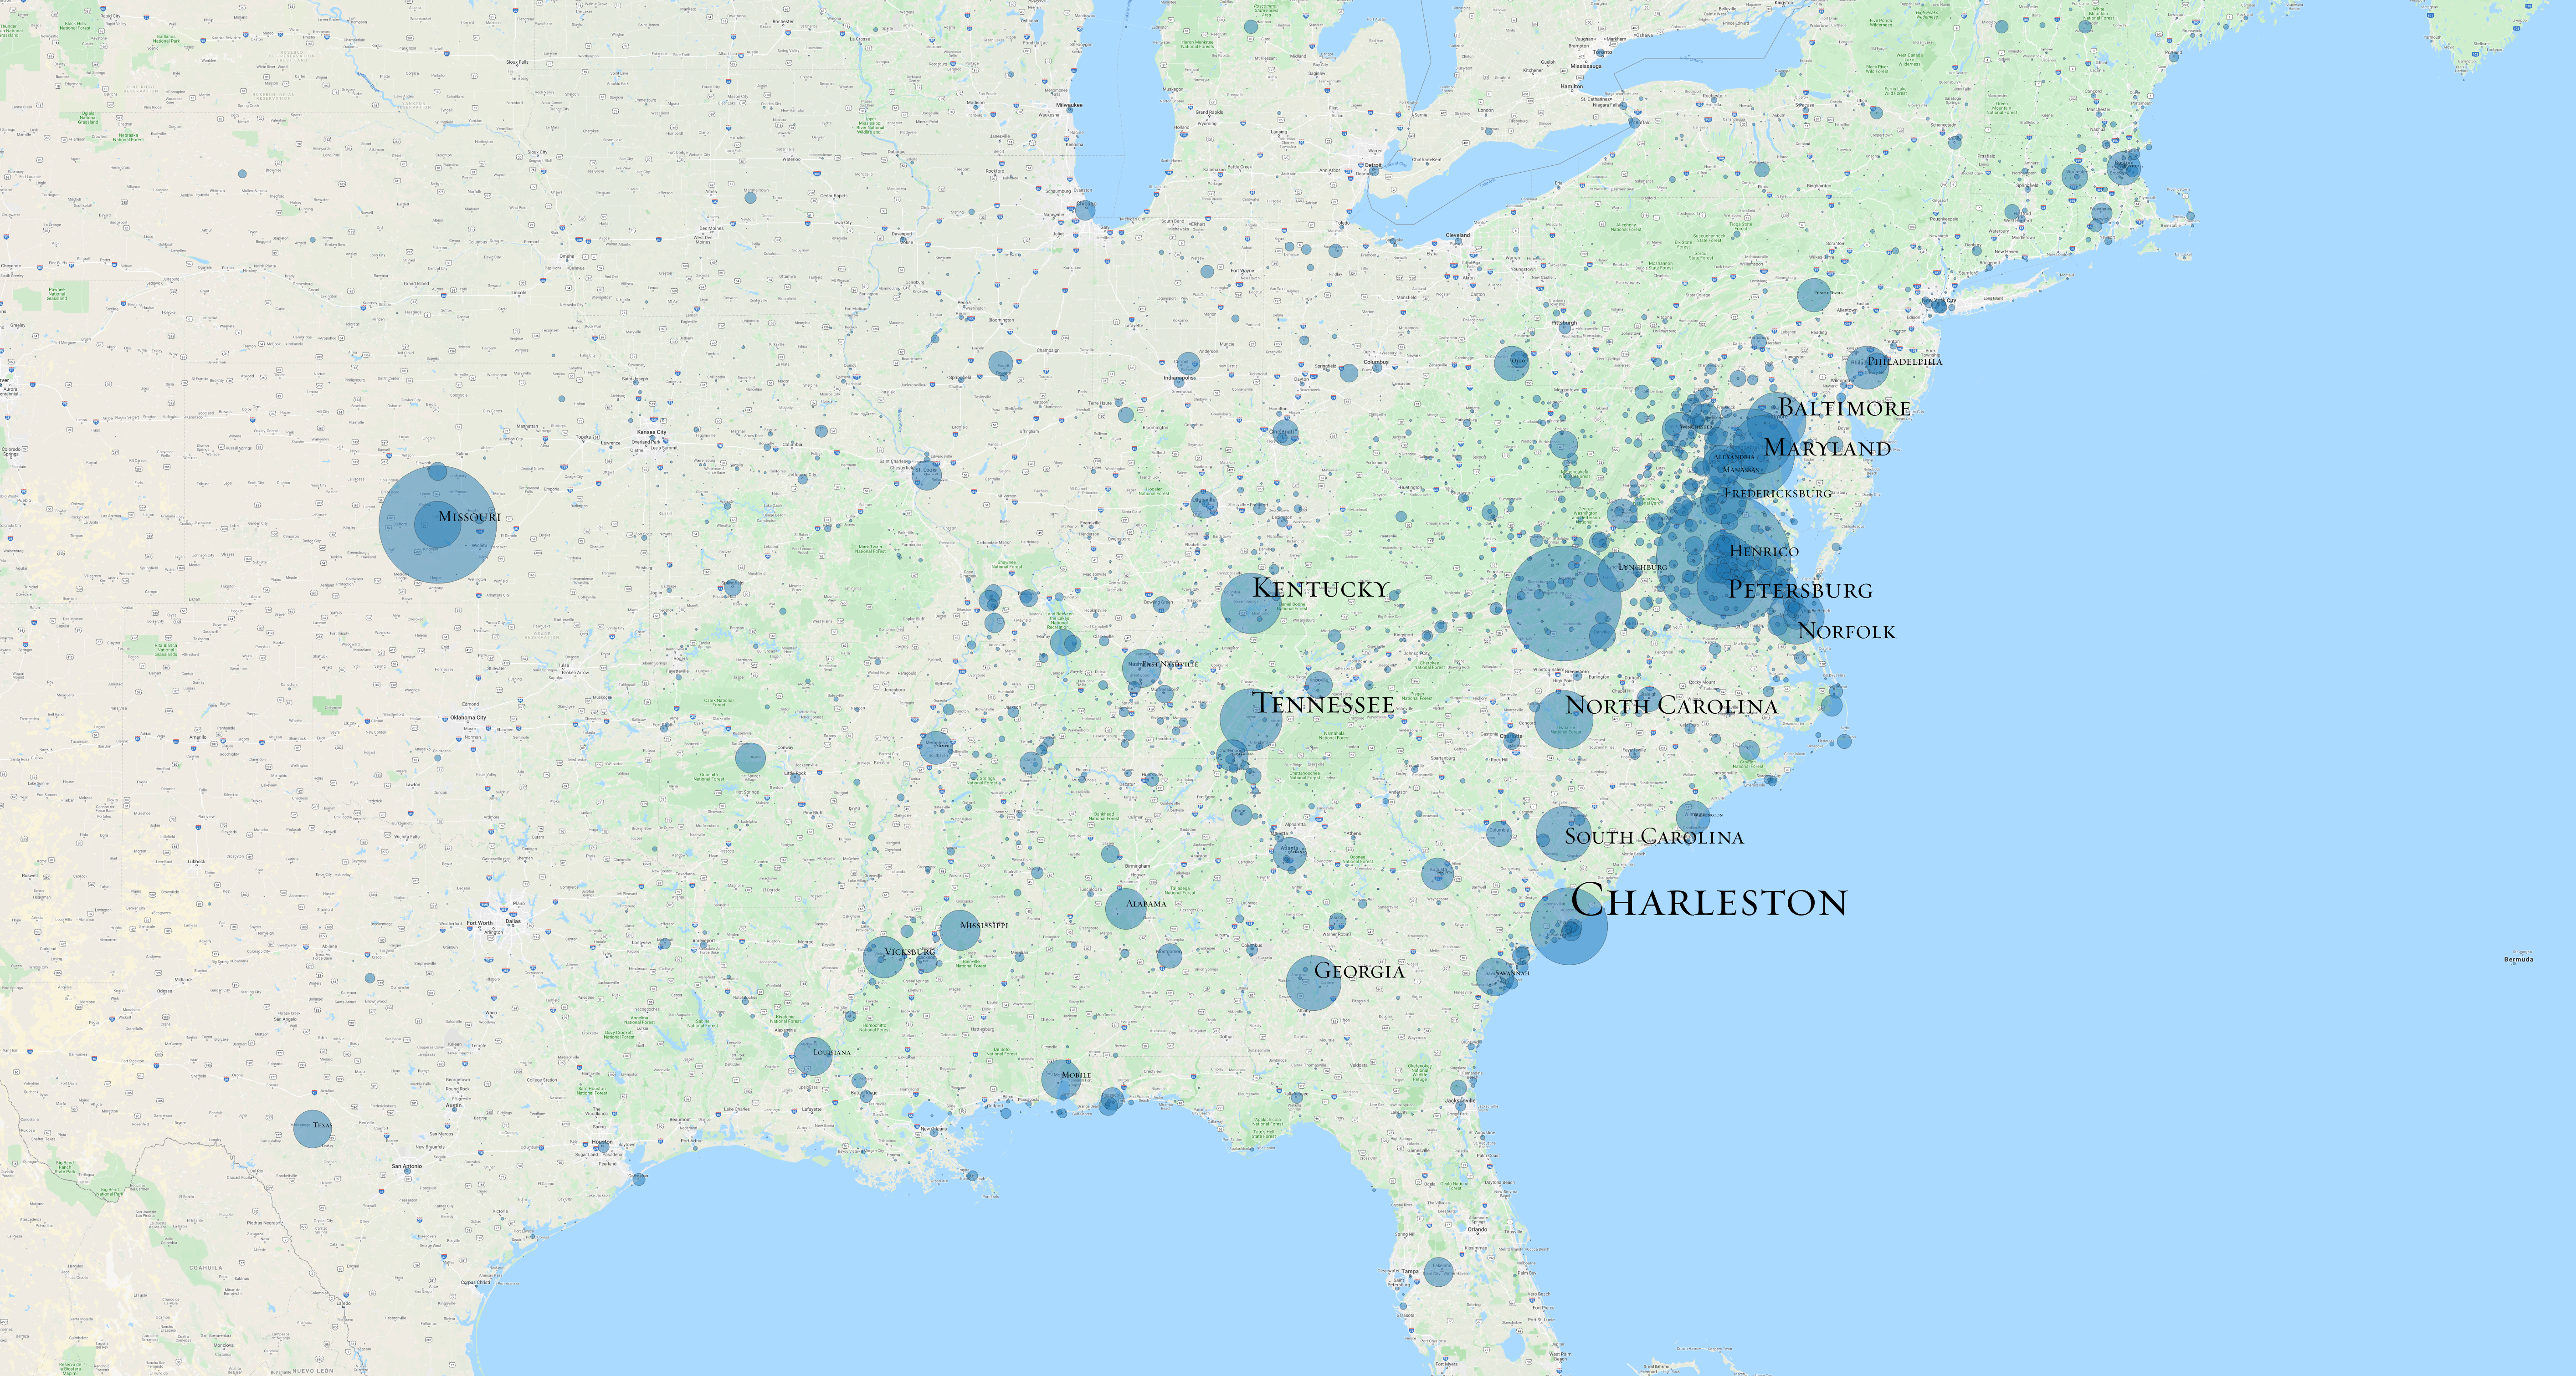
Adding placenames from TGN to the Daily Dispatch
Below are the libraries I’m going to use:
import pandas as pd #for data-structures
import numpy as np #for arrays
from bs4 import BeautifulSoup #to parse xml
import requests #To request files from the web
import re #RegExes!
from tqdm import tqdm_notebook as tqdm # Nice utility to see how fast a loop is progressing.
import traceback #Have a look at errors in exceptions, without interrupting the loop
import json # Parse json.
At the time I was doing this, I didn’t have access to the downloaded data, so I went ahead, downloaded and directly parsed it. So first I needed to get a list of urls with the Daily Dispatches:
soup = BeautifulSoup(open("Richmond.html",encoding='utf-8'))

linklist = []
linktexts = []
for link in soup.findAll('a', attrs={'class': 'aResultsHeader'}):
    linktexts.append(link.text)
    linklist.append(link.get('href').replace('text?','http://www.perseus.tufts.edu/hopper/dltext?'))
Now we loop over the links, retrieve the xml, and figure out the date by looking for a date-tag. For each xml, we also figure out all the placenames by looking for the placename-tag, and extracting all seven-digit numbers from the key-attribute. After that we count their frequencies per edition, and these get appended to a list of dataframes.
all_articles = []
for link, article  in tqdm(zip(linklist,linktexts)):
    try:
        soup = BeautifulSoup(requests.get(link).content)


        date = soup.find('teiheader').find('sourcedesc').find('date').get('value')

        tags_this_edition = []
        for place in soup.findAll('placename'):
            ids_in_tag = re.findall(r"\d{7}",str(place.get('key')))
            [tags_this_edition.append(x) for x in ids_in_tag]
            #This depends on the ids having 7 digits. Seems correct, but I couldn't find it in the docs.

        frequencies_by_index = pd.DataFrame((pd.DataFrame(tags_this_edition)[0].value_counts())).reset_index()
        frequencies_by_index.columns = ['tgn_id','freq']
        frequencies_by_index['date'] = date
        all_articles.append(frequencies_by_index)
    except Exception as err:
        traceback.print_tb(err.__traceback__)


# http://vocab.getty.edu/page/tgn/7022211
#7022211
The dattaframes from our loop get concatenated and saved off to a csv. Doing it this way we still have the frequencies by date, in case we need them later.
df = pd.concat(all_articles)
df.to_csv('place_ids_by_date.csv', index=False)
No we constructan array of all the place-tags that appear in the dispatch.
places = df.tgn_id.unique()
We loop over this array and retrieve the .json associated with it from the tgn-page. From the dictionary that we get from the .json, we extract the bindingskey, which is what contains all the subject, predicat, object-triplets. We loop over those, and construct a dataframe from them, keeping the last letters of the predicate as column-names, and the objects as values, removing duplicated columns.
frames = []

for place in tqdm(places):
    try:
        url = 'http://vocab.getty.edu/tgn/'+str(place)+'.json'
        parsed_json = json.loads(requests.get(url).content)

        bindings = parsed_json['results']['bindings']

        columns = []
        values = []


        for binding in bindings:
            try:
                predicate = binding['Predicate']['value'].split('/')[-1]
                objct = binding['Object']['value']

                columns.append(predicate)
                values.append(objct)
            except Exception as err:
                traceback.print_tb(err.__traceback__)

        frame = pd.DataFrame([values], columns=columns)
        frame = frame.loc[:,~frame.columns.duplicated()]
        frame.id = place
        frames.append(frame)

    except Exception as err:
        traceback.print_tb(err.__traceback__)
Then we concatenate the whole dataframe and save it.
place_data = pd.concat(frames)
place_data.to_csv('tgn_data.csv', index=False)
Now, to put it all together: First we group the dataframe from the newspaper by placenames, and sum the frequencies, to get total frequencies. Then we extract the keys that are interesting to us at the moment from the tgn-dataset. And then we simply join those datasets on the columns that contain the place ids, and save the result to .csv
frequencies = pd.DataFrame(df.groupby('tgn_id')['freq'].sum()).reset_index()

place_data_reduced = place_data[['identifier','latitude','longitude','skos-xl#literalForm']]
#The last one contains the common name of the place.

reduced_combined_places = place_data_reduced.merge(frequencies, how='inner', left_on='identifier', right_on='tgn_id')

reduced_combined_places.to_csv('reduced_combined_places.csv', index=False)
To finish up, we simply load the whole thing into QGIS3, play a little bit with the projection and the point-size, and arrive at this finished product:
